Dipole Bass vs Monopole Bass
Dipole bass vs monopole bass in a small room. Performance analysis with wavelets.
Test Setup
This analysis is based on the impulse response measured at the listening position in the room.
Room size is about 7m * 3.5m * 2.5m (length*width*height), floor area is about 25 m2. This size of room can be considered as a typical European living room.
Loudspeaker under test is placed 70cm from the side wall and 1.2m from the front wall.
Microphone (omni) is placed at the listening position at the longitudal centerline at the height of 1m.
The distance between the loudspeaker and the microphone is 2.5m.
Measurement geometry is shown below. Both monopole and dipole loudspeakers are placed at the same location for measurement.
The dipole radiation axis is aimed at the listening position.
Dipole bass loudspeaker. In this test only the two 12" Peerless XLS are active. Dipole is equalised with Behringer Ultradrive Pro DCX2496.
Monopole bass loudspeaker using 12" Peerless element in 100 litres enclosure. Port is eliminated by stuffing. No equalisation is applied. (This loudspeaker made by AP)
Analysis with Modulated ERB Wavelet
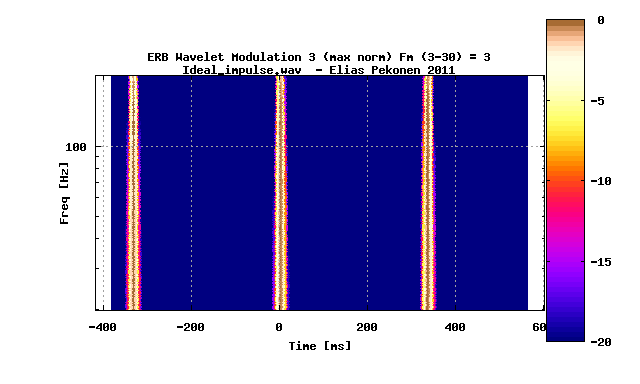
This test signal consists of a sequence of given number of psychoacoustic ERB wavelets. The modulation frequency is the repetition rate of the wavelets in the sequence.
In the first stage of the analysis, the modulation frequency is swept, here in the range between 3 Hz to 30 Hz, and the modulated ERB wavelet transform is calculated.
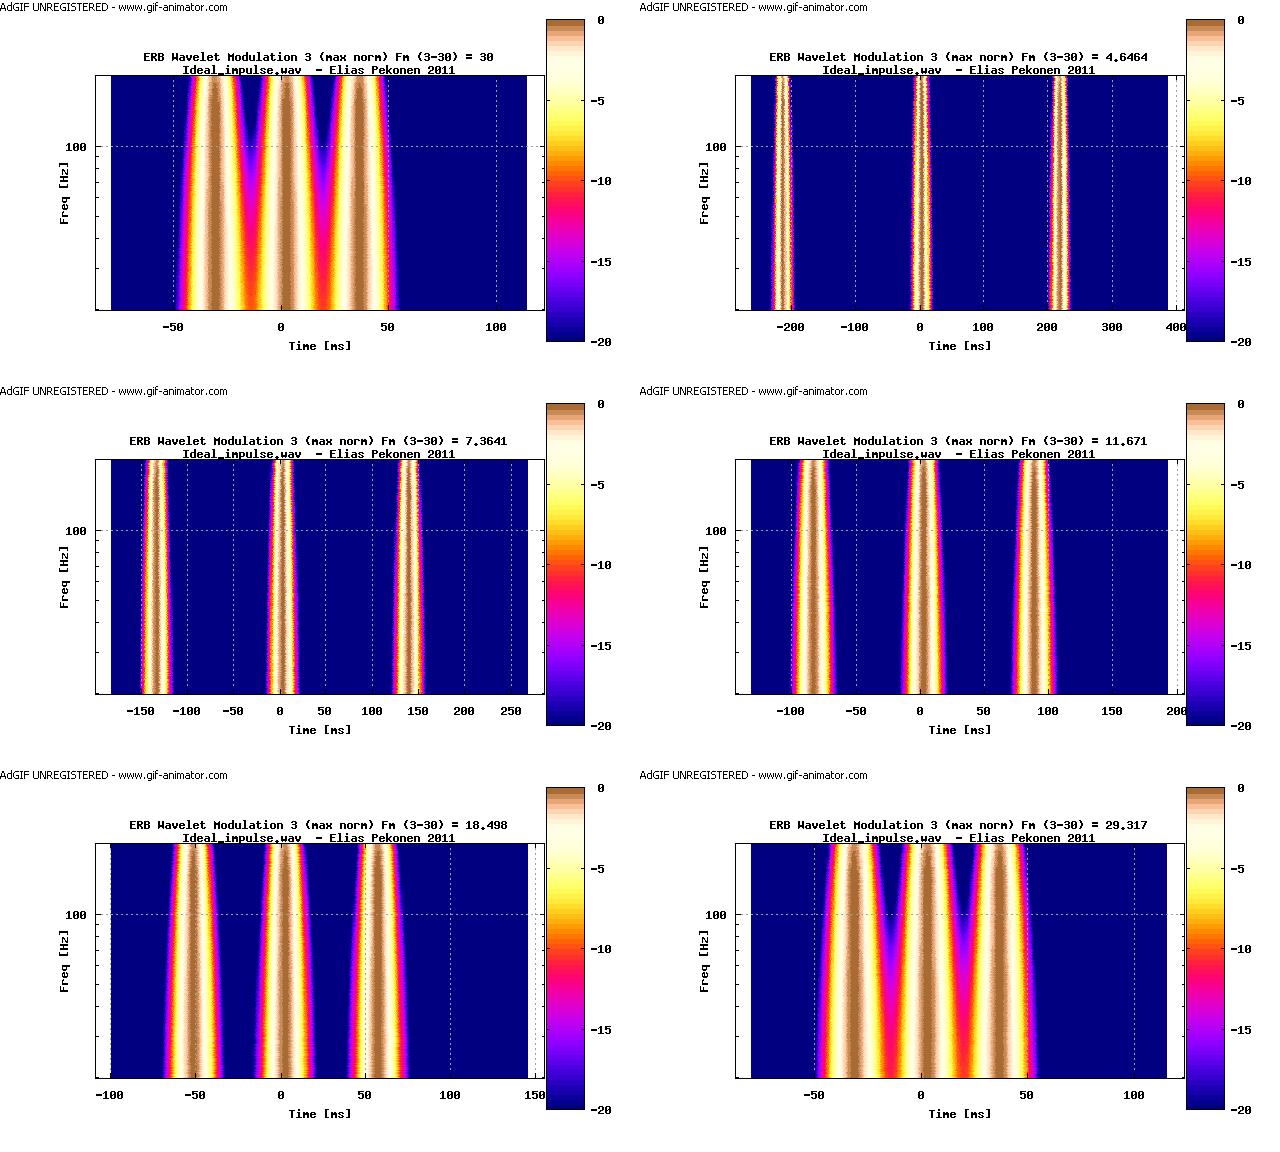
The animation shows the response of the modulated ERB wavelet on ideal impulse response at the center frequencies between 20 Hz to 200 Hz and with modulation frequencies swept between 3 Hz to 30 Hz. The running number at top right corner is the modulation frequency.
Here got: Banana split tango for three :)
In the second stage of the analysis, from the modulated ERB wavelet a modulation transmission is calculated. Transmission describes the level of modulation transfer, and has value of 1 for ideal transfer and value of 0 for no transfer at all.
Here's the description of the transmission function used in this analysis, which is effectively a correlation function squared:
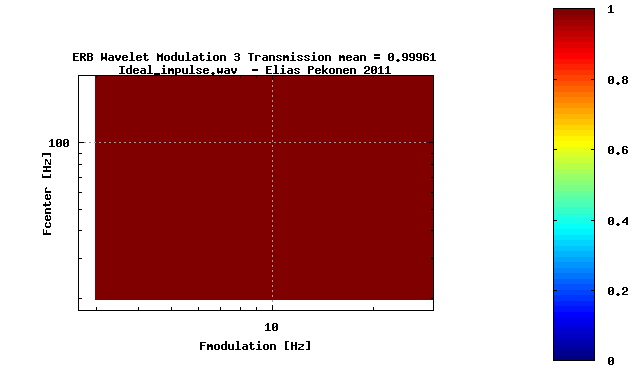
This figure shows the modulation transmission in the modulation domain of the ideal impulse response. It has the value of 1 in every center frequency as well in every modulation frequency.
The mean value at the top right corner is the mean value of the transmission over the modulation domain, and for the ideal case has the value of 1. (In the pic it's less than one, maybe one day I'll fix that ;)
Also the average modulation transmissions from the modulation domain can be calculated along the center frequency and the modulation frequency axes.
This figure shows the average modulation transmission at each center frequencies of 20 Hz to 200 Hz for the modulation frequencies of 3 Hz to 30 Hz for the ideal impulse response. It has the value of 1.
And this figure shows the average modulation transmission at each modulation frequencies of 3 Hz to 30 Hz for the center frequencies of 20 Hz to 200 Hz for the ideal impulse response. It has the value of 1.
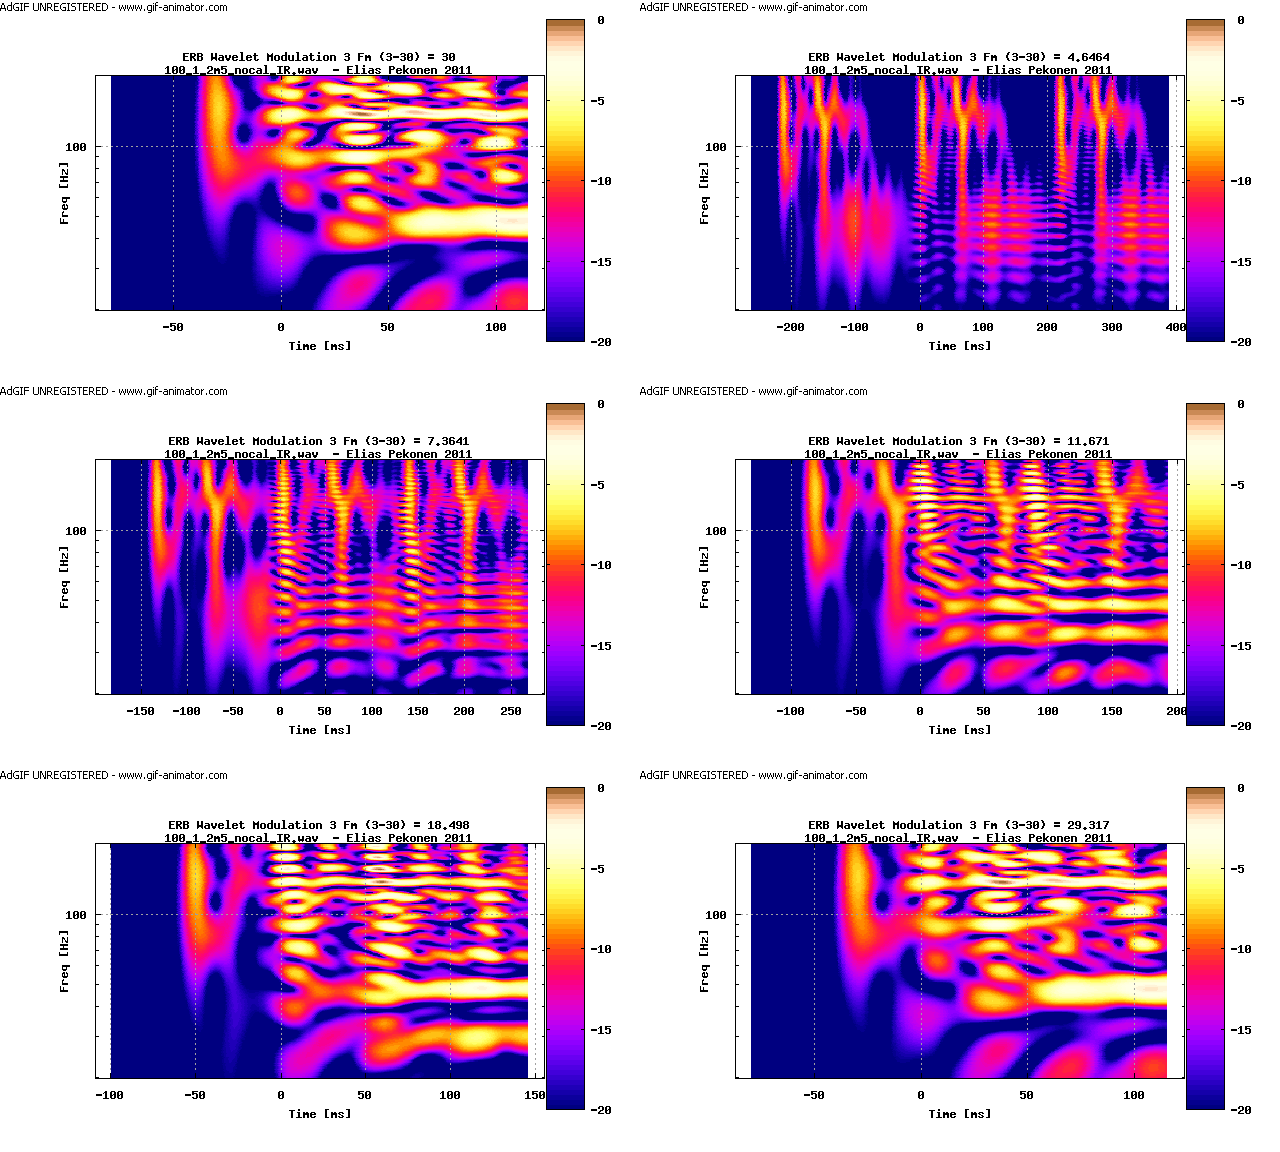
Monopole Bass, animation of modulated ERB wavelet
The animation shows the response of the modulated ERB wavelet on impulse response of the monopole bass at the center frequencies between 20 Hz to 200 Hz and with modulation frequencies swept between 3 Hz to 30 Hz.
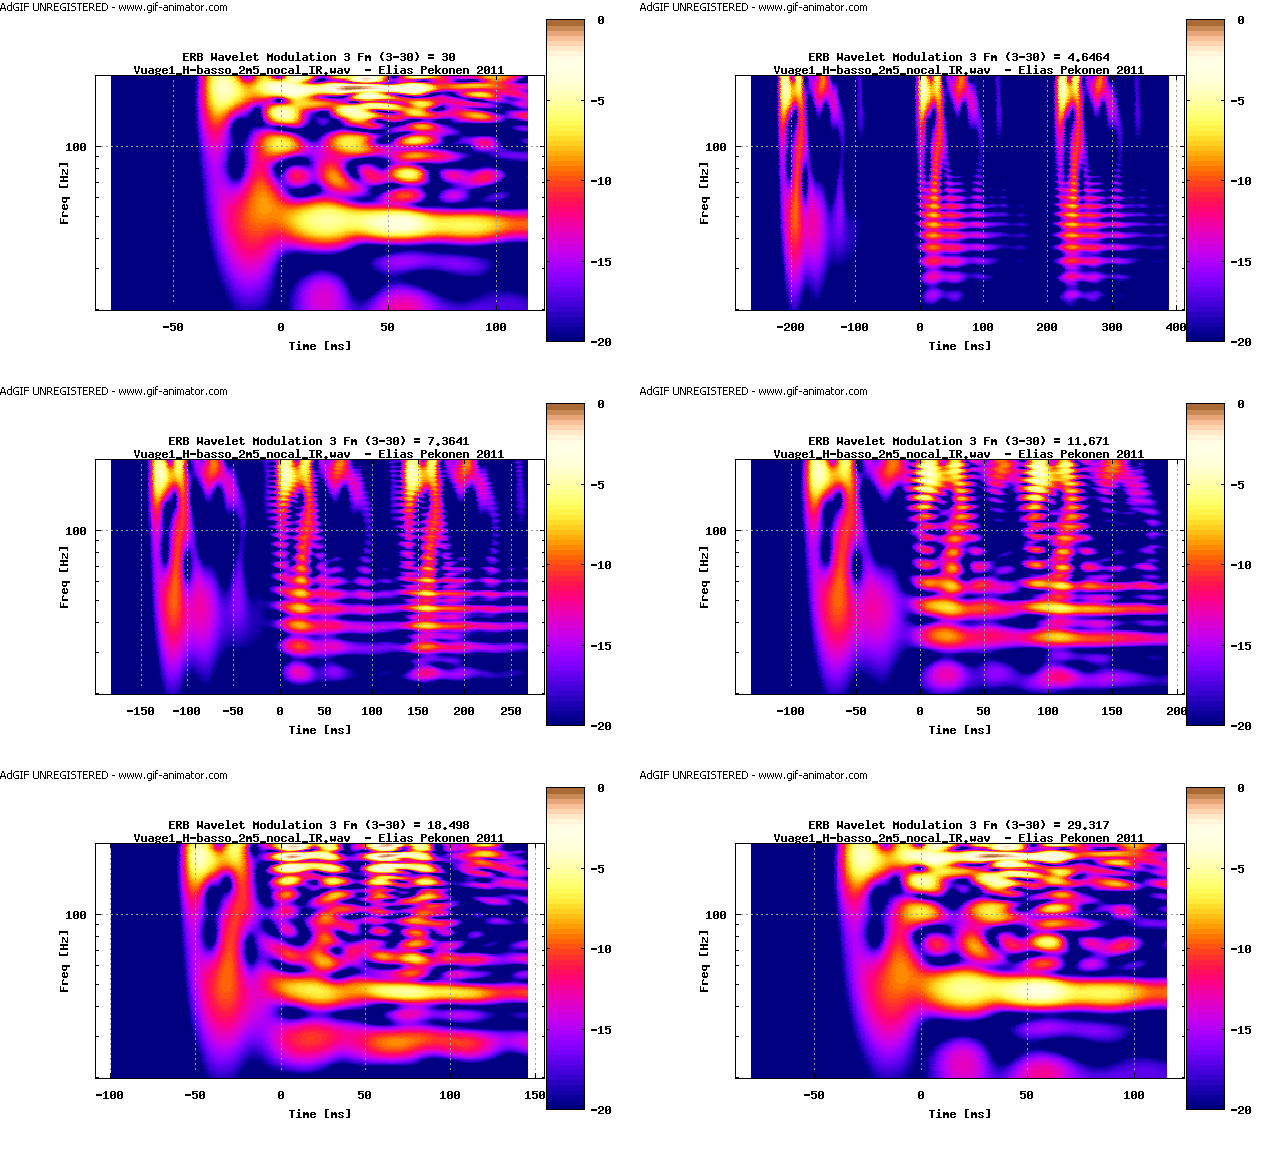
Dipole Bass, animation of modulated ERB wavelet
The animation shows the response of the modulated ERB wavelet on impulse response of the dipole bass at the center frequencies between 20 Hz to 200 Hz and with modulation frequencies swept between 3 Hz to 30 Hz.
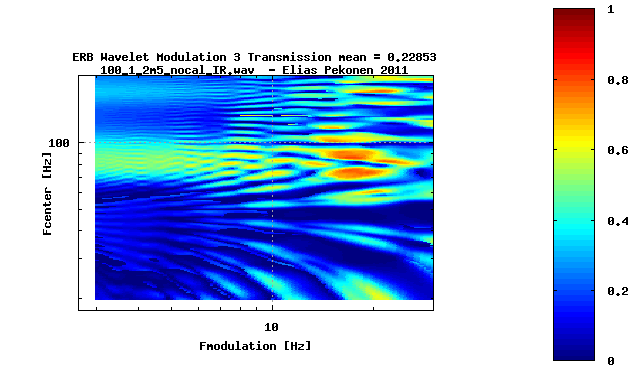
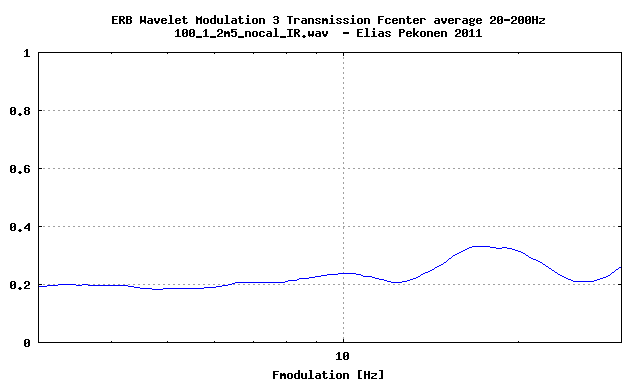
Monopole Bass, ERB wavelet modulation transmission
Here is the modulation transmission of the monopole bass at the center frequencies of 20 Hz to 200 Hz and with the modulation frequencies of 3 Hz to 30 Hz:
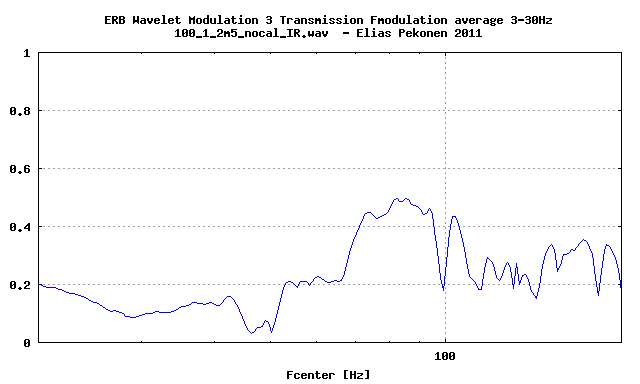
Here is the average of the modulation transmission of the monopole bass at each center frequency:
Here is the average of the modulation transmission of the monopole bass at each modulation frequency:
Dipole Bass, ERB wavelet modulation transmission
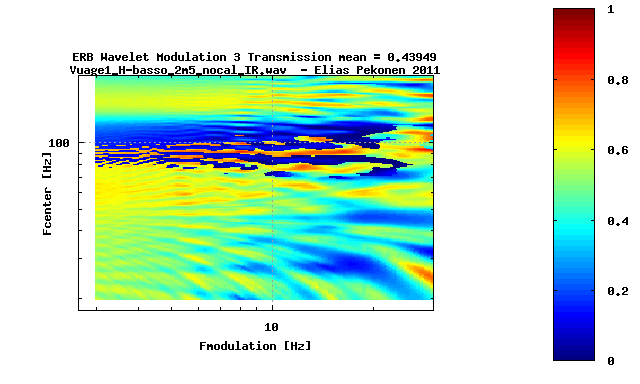
Here is the modulation transmission of the dipole bass at the center frequencies of 20 Hz to 200 Hz and with the modulation frequencies of 3 Hz to 30 Hz.
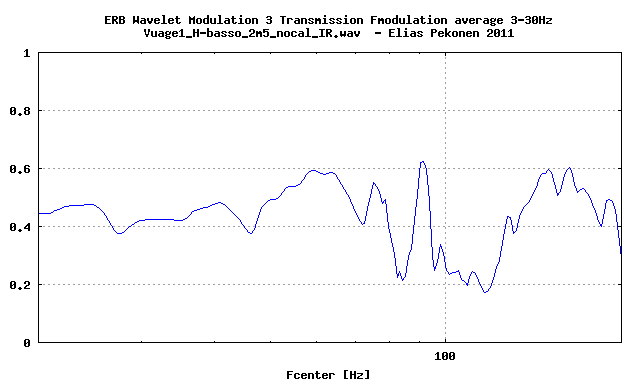
Here is the average of the modulation transmission of the dipole bass at each center frequency:
Here is the average of the modulation transmission of the dipole bass at each modulation frequency:

Next comparison of Monopole and Dipole bass at some selected modulation frequencies
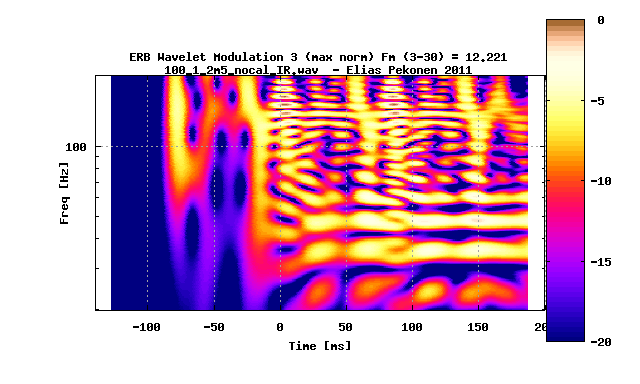
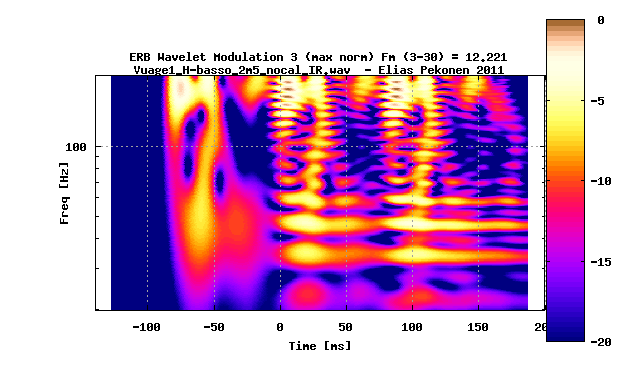
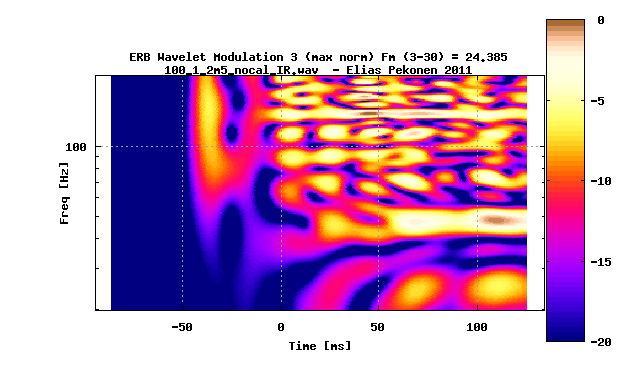
In the following figure titles, the monopole bass is indicated by "100_1" and dipole bass by "H-basso". Don't get confused :)
Modulated ERB Wavelet at Modulation frequency 3 Hz: Ideal Impulse response vs. Monopole Bass vs. Dipole Bass
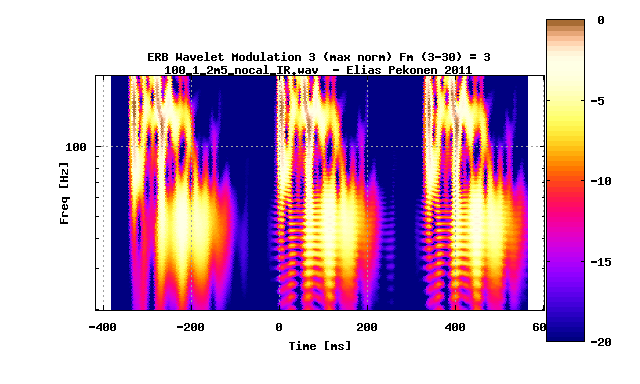
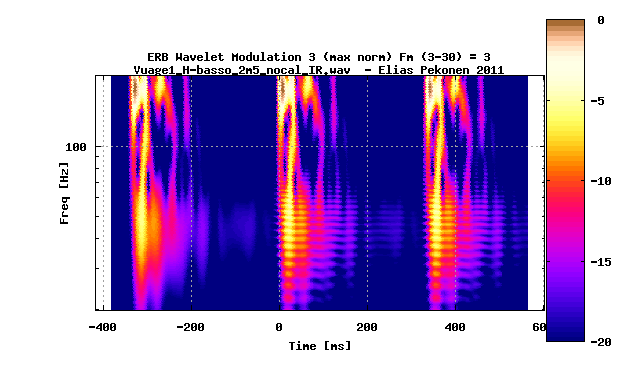
Modulated ERB Wavelet at Modulation frequency 5 Hz: Ideal Impulse response vs. Monopole Bass vs. Dipole Bass
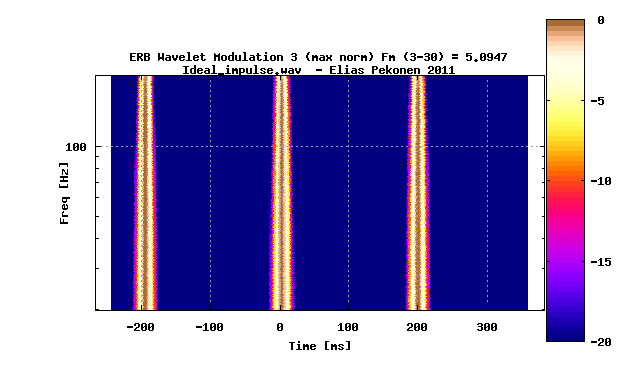

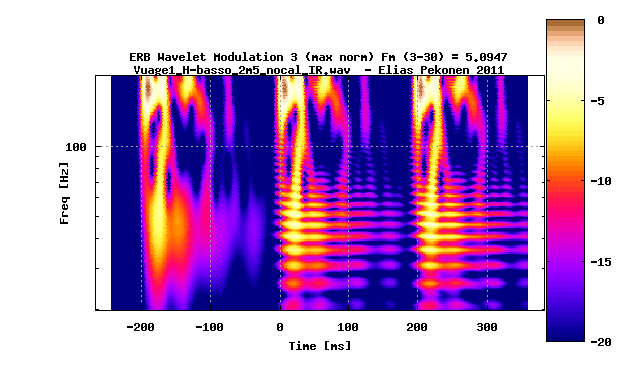
Modulated ERB Wavelet at Modulation frequency 8 Hz: Ideal Impulse response vs. Monopole Bass vs. Dipole Bass
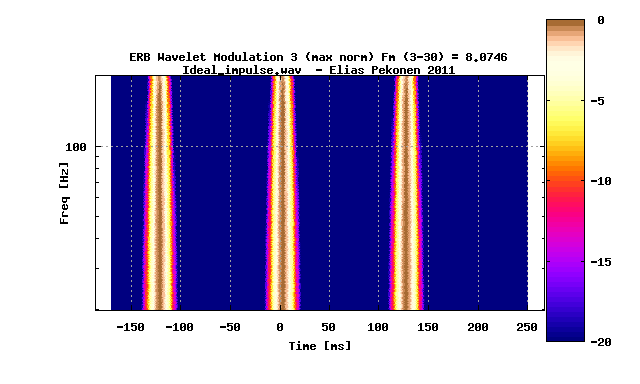
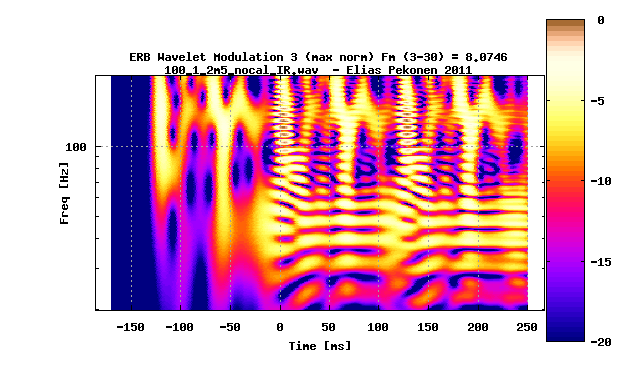
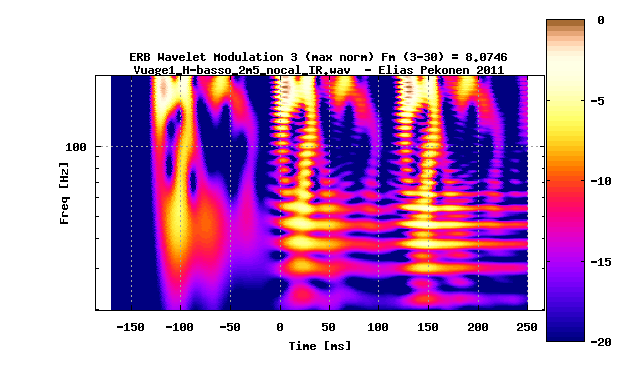
Modulated ERB Wavelet at Modulation frequency 12 Hz: Ideal Impulse response vs. Monopole Bass vs. Dipole Bass
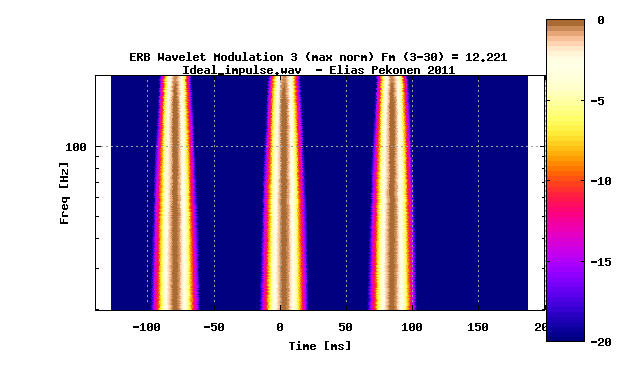
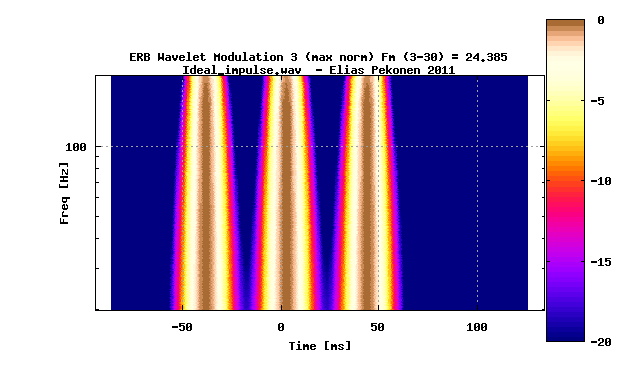
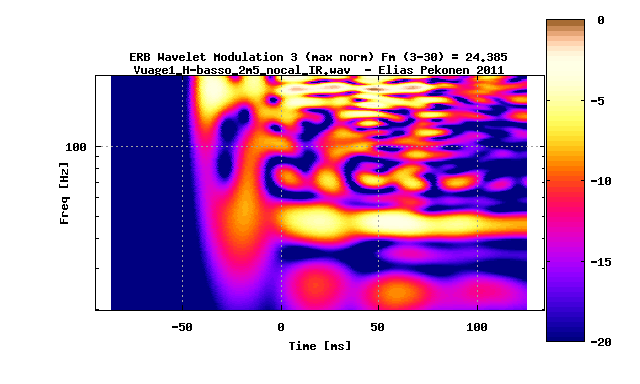
Modulated ERB Wavelet at Modulation frequency 24 Hz: Ideal Impulse response vs. Monopole Bass vs. Dipole Bass
Conclusions of the Modulated ERB Wavelet Analysis
-
The modulated ERB wavelet analysis shows a clear performance difference between the monopole and dipole bass loudspeakers in a small room acoustic space.
-
The dipole bass has considerably higher modulation transmission than the monopole bass in the center frequency range of 20 Hz to 200 Hz and with the modulation frequencies between 3 Hz to 30 Hz. The monopole has a mean value of modulation transmission in the above frequency ranges of 0.23 whereas for the dipole bass it is 0.44. This is notably higher for the dipole bass.
-
Also the visual examination of the modulated ERB wavelets for different modulation frequencies shows clear performance benefit of the dipole bass over the monopole bass. The difference is clear in the modulation frequencies starting from 3 Hz up to about 12 Hz.
-
At the modulation frequency of about 24 Hz and higher neither monopole bass nor dipole bass is able to accourately reproduce the modulation in a small room acoustic space.
Analysis with Modulated Constant Q Wavelet
This test signal consists of a sequence of given number of Constant Q wavelets. The modulation frequency is the repetition rate of the wavelets in the sequence.
Example of the analysis signal having 3 wavelet sequence at the center frequency of 50Hz showing the waveform (blue) and the envelope (black).
For ideal impulse response the modulation wavelet is shown between 20Hz-100Hz in 40dB amplitude range.
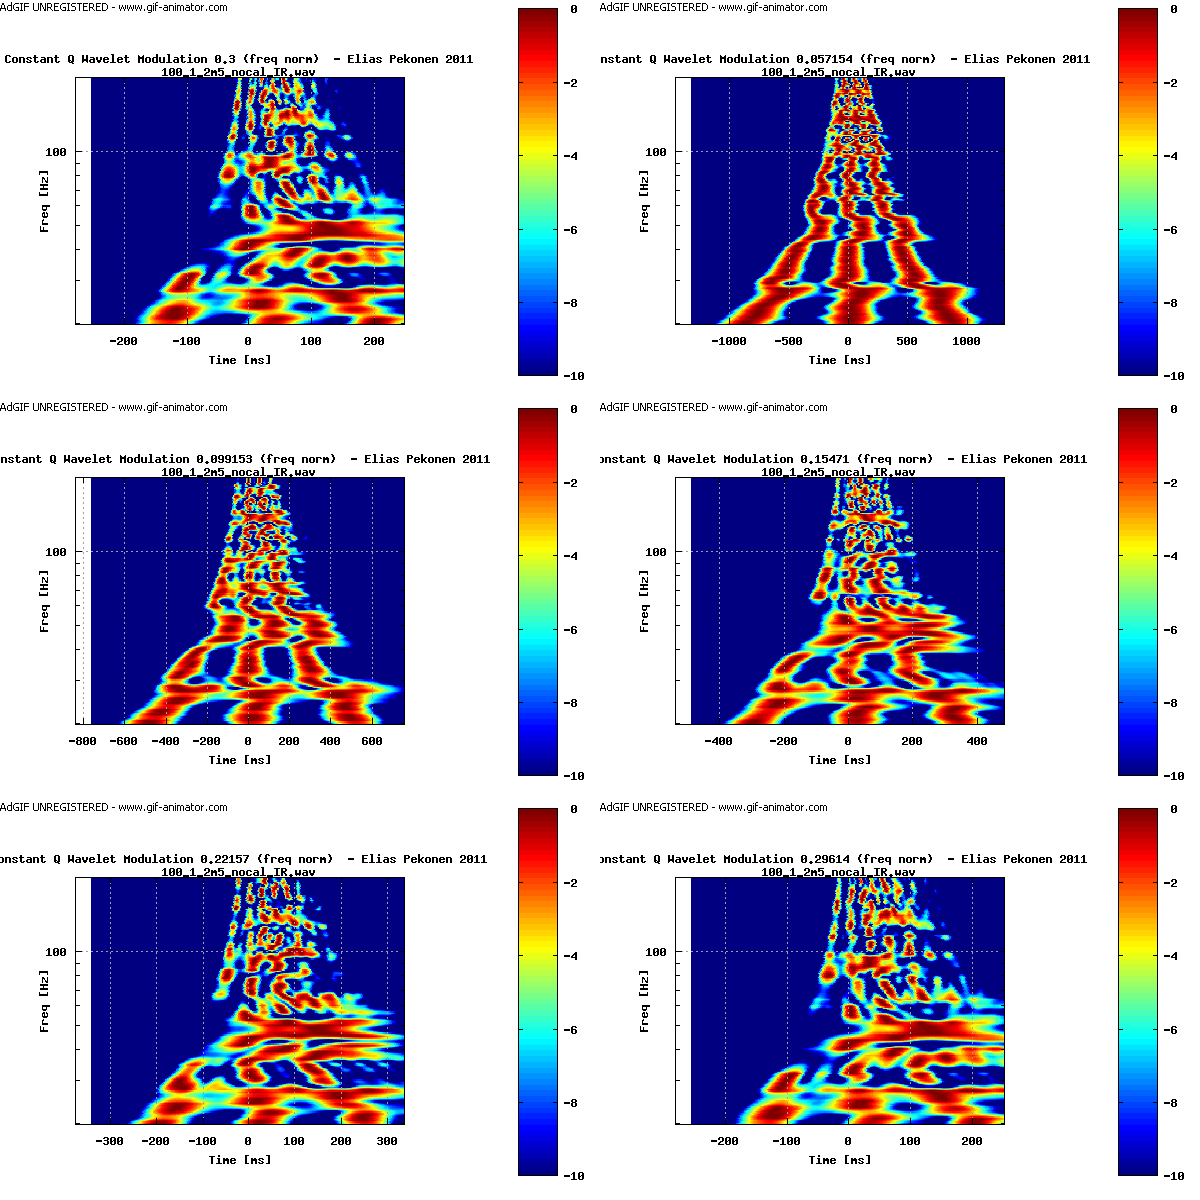
Monopole Bass, Animation of Modulated Constant Q Wavelet
This animation shows the monopole bass analysed with the Modulated Constant Q Wavelet at the center frequencies between 20Hz and 200Hz. The modulation range is swept from 0.03 to 0.3.
(that is: modulation freq / center freq, in a constant Q manner. For example: for center frequency of 100 Hz the modulation frequency is swept from 3 Hz to 30 Hz, and for center frequency of 50 Hz the modulation frequency is swept from 1.5 Hz to 15 Hz).
Dipole Bass, Animation of Modulated Constant Q Wavelet
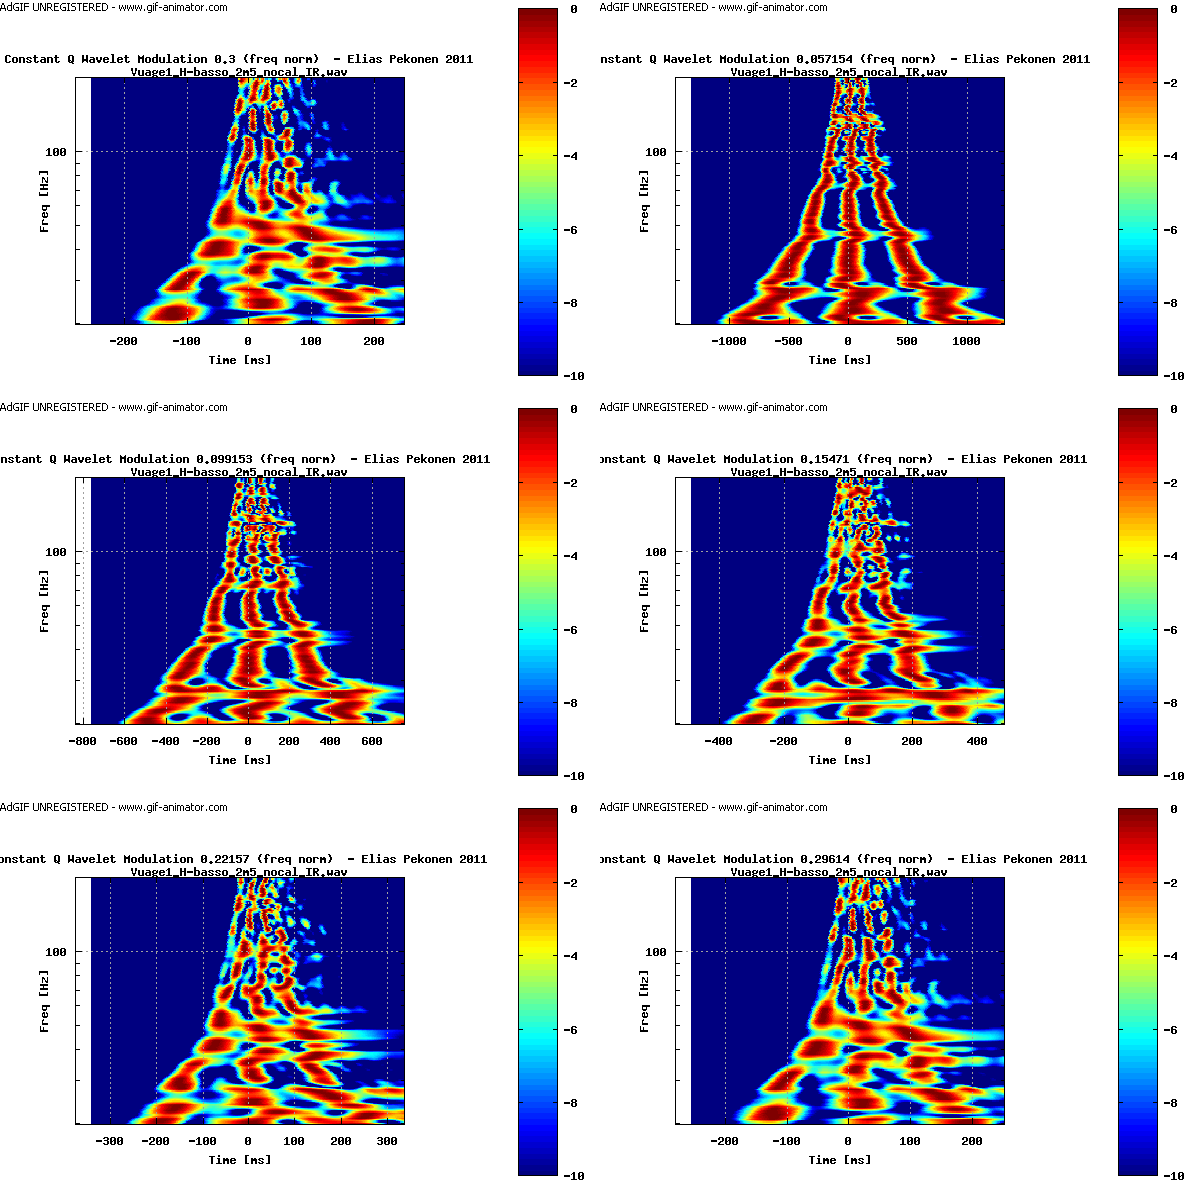
This animation shows the dipole bass analysed with the Modulated Constant Q Wavelet at the center frequencies between 20Hz and 200Hz. The modulation range is swept from 0.03 to 0.3
(that is: modulation freq / center freq, in a constant Q manner. For example: for center frequency of 100 Hz the modulation frequency is swept from 3 Hz to 30 Hz, and for center frequency of 50 Hz the modulation frequency is swept from 1.5 Hz to 15 Hz).
Next comparison of Monopole and Dipole bass at some selected modulation frequency
Monopole Bass vs Dipole Bass (20Hz-100Hz, maximum normalised, 40dB scale)
Here's the monopole bass analysed with the modulation wavelet
Here's the dipole bass analysed with the modulation wavelet
Monopole Bass vs Dipole Bass (20Hz-100Hz, normalised along frequency axis, 40dB scale)
Monopole bass
Dipole bass
Monopole Bass vs Dipole Bass (20Hz-100Hz, normalised along frequency axis, 20dB scale)
Ideal Impulse
Monopole bass
Dipole bass
Monopole Bass vs Dipole Bass (20Hz-100Hz, normalised along frequency axis, 10dB scale)
Ideal Impulse
Monopole bass
Dipole bass
Conclusions of the Modulated Constant Q Wavelet
-
Also the modulated constant Q wavelet analysis shows a clear performance difference between the monopole and dipole bass loudspeakers in a small room acoustic space.
-
In a small room dipole loudspeaker reproduces the temporal structure of the bass signal better than the monopole loudspeaker.
-
At most of the analysis frequencies the monopole bass loses the ability to reproduce the modulated signal.
Summaring Remarks
-
The information in the real life music signal is composed by signal modulations. Without the modulation signal has no information, it would not be music.
-
A reproduction system providing more accourate transmission of the signal modulations is to be considered a better system for music reproduction.
-
It has been shown with modulated ERB wavelet and modulated constant Q wavelet that dipole bass reproduces the modulation better than monopole bass.
-
Thus in the bass range a dipole loudspeaker is better suited for music reproduction in a small room acoustic space than a monopole loudspeaker.
